Scaling a Public “Talk to Bot” Button to Thousands of Concurrent Users
Production scaling guide for WebRTC voice buttons covering DTLS cost, TURN capacity planning, horizontal scaling, and avoiding Asterisk bottlenecks.
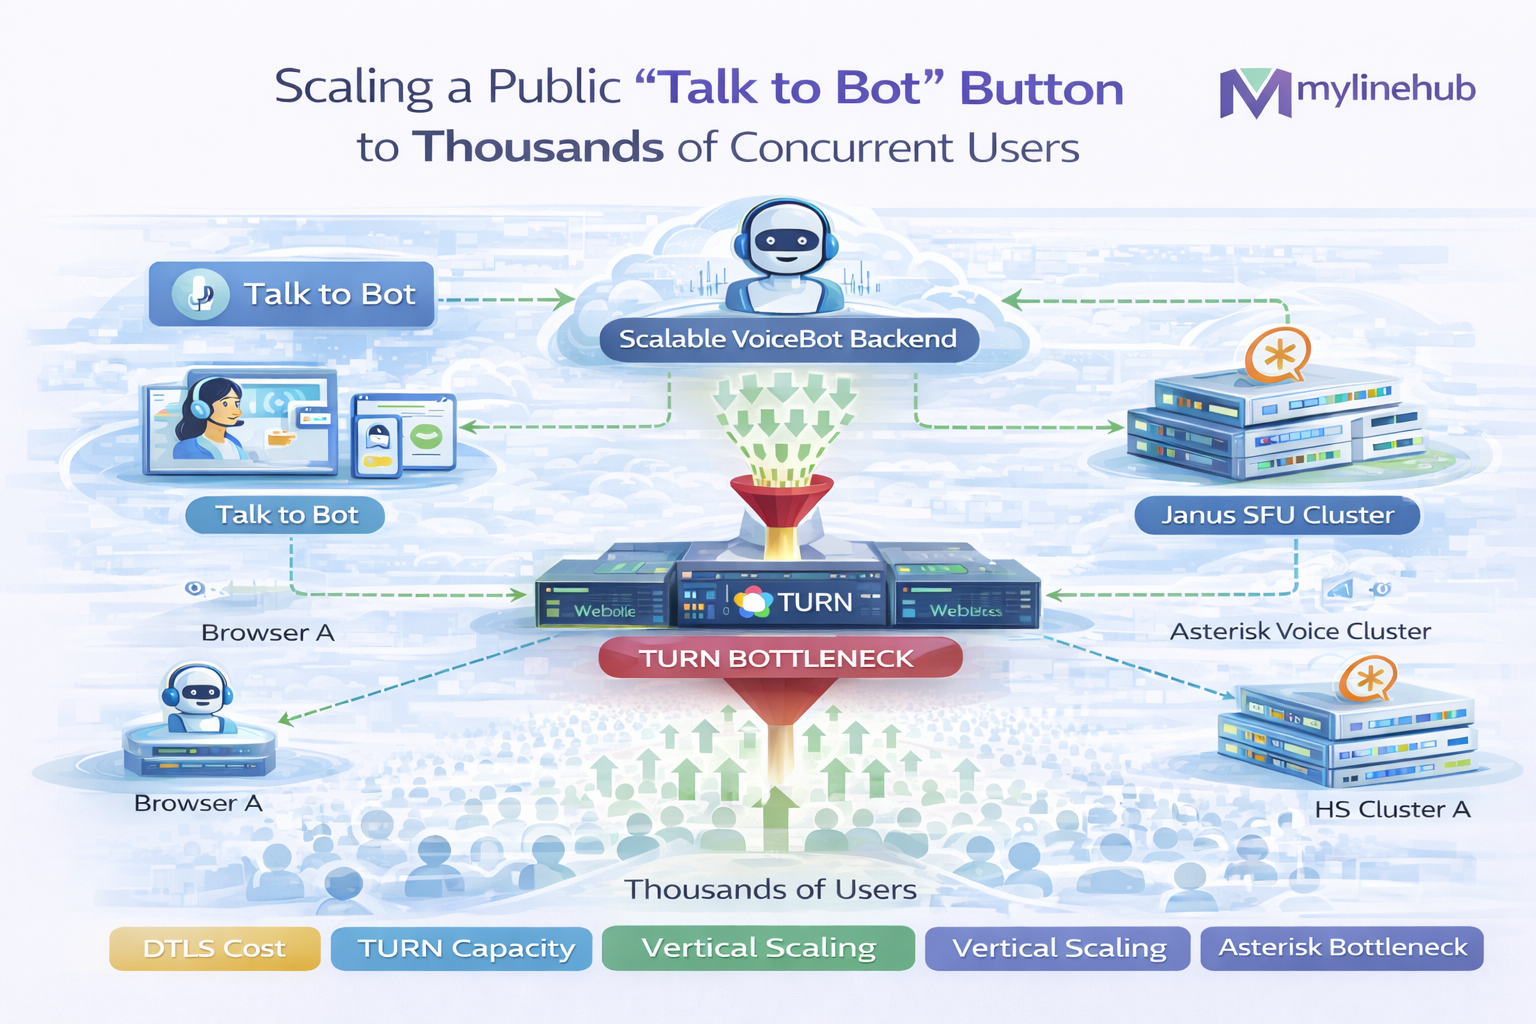
WebRTC • Click-to-Call Button • AI Voice Bot • Janus/LiveKit/mediasoup • TURN • Asterisk/FreeSWITCH
Scaling a “Talk to Bot” WebRTC Button to Thousands of Users (Real Architecture, Costs, and Pitfalls)
A “Talk to Bot” button looks simple: user clicks, browser asks for mic permission, and suddenly they are talking to an AI voice bot. But when you scale from 10 testers to 10,000 daily users (or thousands of concurrent users), everything changes.
The biggest mistake teams make is treating WebRTC like a normal API call: “If our web server scales, the voice button will scale.” WebRTC is real-time media — latency-sensitive, bandwidth-heavy, NAT-sensitive, and it requires different scaling and monitoring than typical web apps.
What you will get from this guide:
- A novice-friendly explanation first (layman examples), then deeper engineering detail.
- Concrete scaling patterns: TURN, gateway/SFU sizing, region placement, and autoscaling triggers.
- Capacity planning tables (bandwidth math, concurrency, CPU/RAM considerations).
- Production checklists: ports, NAT, observability, load testing, and “why it works in dev but fails in prod”.
- Where SIP servers (Asterisk/FreeSWITCH) fit, and when to introduce Janus / LiveKit / mediasoup.
Contents
1) Layman view: what “scaling voice” really means 2) The components of a click-to-call AI voice stack 3) Topologies: P2P, Gateway (Janus), SFU (LiveKit/mediasoup) 4) TURN at scale: the reliability layer you must plan for 5) Capacity planning: bandwidth, concurrency, CPU, cost 6) Multi-region design: where to place TURN + media servers 7) Bridging to SIP: Asterisk/FreeSWITCH patterns that scale 8) AI pipeline scaling: STT/TTS, barge-in, jitter buffers 9) Observability: what to monitor (and why) 10) Load testing WebRTC properly (not just HTTP) 11) Security & abuse prevention at scale 12) Production checklists and common failure modes 13) References & next readingQuick links (required format)
- WebRTC Website Voice Button AI Bot Architecture
- ICE vs STUN vs TURN — Complete WebRTC Networking Guide
- Why WebRTC Calls Fail Behind NAT (and How TURN Fixes It)
- Janus WebRTC Gateway Installation on Ubuntu (Production)
- Best Choice for Click-to-Call AI Bot (Janus vs LiveKit vs mediasoup)
- Connect Janus to Asterisk (Extension 7000) Using SIP + ARI
This article focuses on scaling. Networking/TURN and gateway choices are referenced above.
1) Layman view: what “scaling voice” really means
Scaling a web page vs scaling a live call
A web page is like sending a PDF to someone — you can cache it, retry it, and deliver it eventually. A live voice call is like a walkie-talkie conversation — if packets arrive late, the conversation feels broken.
- Web: “If it’s slow, user waits.”
- Voice: “If it’s slow, user hangs up.”
Scaling voice is mostly about 4 things
- Network reachability (NAT/firewalls) → solved by TURN
- Bandwidth (media traffic) → planning + multi-region
- Real-time processing (STT/TTS/AI) → concurrency + backpressure
- Operational visibility → monitoring that tells you what users experience
Rule of thumb: if your click-to-call works for 95% of users, it will still feel “broken”. People remember voice failures more than slow page loads.
Your target is not “mostly works”. Your target is “works everywhere”.
2) The components of a click-to-call AI voice stack
A production voice button is not one server. It’s a chain. When calls fail, you must know which link failed.
| Layer | Example tech | Why it exists | Scaling concern |
|---|---|---|---|
| Browser UI | JS + WebRTC APIs | Mic capture, UX, permissions | Device diversity, permission flows |
| Signaling | HTTPS/WSS | Exchange SDP and ICE candidates | State, auth, retries |
| NAT traversal | STUN/TURN (coturn) | Reachability across networks | Bandwidth + regional placement |
| Media gateway/SFU | Janus / LiveKit / mediasoup | Anchor media; bridge to SIP or AI pipeline | CPU, memory, packet pacing |
| SIP/PBX (optional) | Asterisk / FreeSWITCH | Enterprise calling, extensions, PSTN | RTP ports, transcoding cost |
| AI voice | STT + LLM + TTS | Understand and respond | Latency budgets, concurrency limits |
| Observability | Metrics/logs/traces + QoE | Know why calls fail | Cardinality, sampling |
Scaling tip: split “control plane” from “media plane”.
- Control plane = signaling, auth, session routing (scales like web)
- Media plane = RTP/SRTP packets, TURN relay traffic (scales like networking)
3) Topologies: P2P, Gateway (Janus), SFU (LiveKit/mediasoup)
3.1 Pure P2P (not recommended for bot calls)
Browser sends media directly to another peer. Great for two humans on good networks. Bad for “browser ↔ bot” because your bot is not a browser and you still need an anchor server.
- Cons: NAT complexity, hard to integrate SIP, hard to measure QoE
- Pros: low infra cost when it works
3.2 Gateway model (Janus as anchor)
Browser connects to Janus. Janus terminates WebRTC and provides plugin-based routing: SIP plugin to Asterisk, or custom logic to an AI pipeline.
- Pros: simple mental model, great SIP bridge story
- Cons: you must size gateways and TURN; multi-region planning
3.3 SFU model (LiveKit/mediasoup)
Browser connects to an SFU. SFU optimizes multi-party calls and routing. For a bot button, you’re often still doing 1:1, but SFUs offer strong tooling and scaling patterns.
- Pros: mature scaling patterns, multi-party ready
- Cons: SIP bridging can be extra work; complexity may be higher
Practical recommendation for “Talk to Bot”:
- Use an anchor server (Janus or SFU) rather than “direct to bot”.
- Use TURN as a required fallback path (and size it).
- Split control-plane vs media-plane scaling.
4) TURN at scale: the reliability layer you must plan for
At small scale, you might get away with only STUN — most tests happen on permissive networks. At real scale, your user base includes corporate firewalls, carrier NAT, and “weird routers”. TURN is what converts “sometimes works” into “works reliably”.
4.1 TURN is not just “one server”
- Placement matters: TURN far away increases latency and jitter.
- Bandwidth matters: TURN relays media — it carries your traffic.
- Protocol coverage matters:
- TURN/UDP (best)
- TURN/TCP (fallback)
- TURN/TLS on 443 (enterprise networks)
4.2 TURN usage rate (why you must measure it)
Not all users will use TURN. ICE tries direct (host/srflx) first. A healthy system will have a mix:
- Some sessions: direct (srflx)
- Some sessions: relay (TURN)
Your cost depends on % relay. Without monitoring, you are flying blind.
| Decision | Option | Impact | When to choose |
|---|---|---|---|
| TURN policy | TURN as fallback | Lower cost, slightly more failure risk if direct checks lie | When you have good monitoring and can iterate |
| TURN policy | Force relay (iceTransportPolicy=relay) | Highest reliability, higher cost, consistent behavior | When you must be “enterprise reliable” or debugging |
| TURN geography | Single region | Simple, higher latency for distant users | Pilot / local audience |
| TURN geography | Multi-region | Lower latency globally, operational complexity | Global users, higher concurrency |
Minimum viable production TURN:
- At least 2 TURN nodes (HA), ideally behind DNS-based routing.
- TURN/UDP + TURN/TLS 443 enabled.
- Relay port range opened on firewall.
- Ephemeral credentials issued by backend (no static creds in JS).
Related reading: Why WebRTC Calls Fail Behind NAT (and How TURN Fixes It)
5) Capacity planning: bandwidth, concurrency, CPU, cost
“Thousands of users” can mean: thousands of daily visitors (low concurrency) or thousands of concurrent calls (high concurrency). Concurrency is what drives infra sizing.
5.1 Define your traffic reality
| Metric | Example | Why it matters |
|---|---|---|
| Daily unique visitors | 50,000/day | Controls auth/signaling scale |
| Click-to-call conversion | 2% | How many sessions become calls |
| Average call duration | 3 minutes | Controls concurrent load |
| Peak factor | 5× average | Determines worst-case sizing |
| % calls using TURN | 30–70% | Determines TURN bandwidth cost |
Without these numbers, you can’t size TURN/media servers correctly.
5.2 Bandwidth is the first hard limit
Even “audio only” has overhead. Real-world effective bitrate depends on codec, packetization, and network. Use a safe range.
| Audio mode | Rough per-direction budget | Duplex (both ways) | Notes |
|---|---|---|---|
| Opus voice (typical) | 30–80 kbps | 60–160 kbps | Depends on ptime, overhead, network |
| G.711 (PCMU/PCMA) | 80–110 kbps | 160–220 kbps | Common when bridging to SIP/PBX |
TURN relays the traffic, so TURN bandwidth is roughly proportional to concurrent calls × duplex bitrate × % relay.
5.3 Simple concurrency math (use your numbers)
A practical approximation: concurrent_calls ≈ (calls_per_hour × avg_duration_minutes) / 60 then multiply by a peak factor.
# Example (replace with your real metrics)
visitors_per_day = 50000
conversion = 0.02                 # 2% click-to-call
calls_per_day = visitors_per_day * conversion   # 1000 calls/day

# If most calls happen in 8 busy hours
calls_per_hour = calls_per_day / 8              # 125 calls/hour

avg_duration_min = 3
concurrent_avg = (calls_per_hour * avg_duration_min) / 60  # 6.25

peak_factor = 5
concurrent_peak = concurrent_avg * peak_factor  # ~31 calls peak
This is why “thousands of daily users” might still mean only dozens of concurrent calls. But if you are a call center entry point, concurrency can be hundreds or thousands.
5.4 TURN bandwidth estimate table
| Concurrent calls | Duplex bitrate (kbps) | % relay | Approx TURN egress (Mbps) | Interpretation |
|---|---|---|---|---|
| 50 | 160 | 50% | ~4 Mbps | Small production, single node possible |
| 500 | 160 | 60% | ~48 Mbps | Need multiple TURN nodes + monitoring |
| 2,000 | 160 | 70% | ~224 Mbps | Multi-region TURN + capacity engineering |
Estimate: egress_mbps ≈ concurrent_calls × duplex_kbps × relay_fraction / 1000. This is approximate; plan safety margin.
The “hidden cost” at scale: TURN bandwidth.
If you run TURN in cloud environments with egress billing, your cost scales with usage. That’s why measuring % relay and placing TURN near users matters.
6) Multi-region design: where to place TURN + media servers
In voice, distance is delay. Delay becomes conversational friction. Multi-region is how you keep latency low for global users.
6.1 Basic placement rule
- Place TURN close to users (or at least not extremely far).
- Place media anchor (Janus/SFU) close to users too.
- Place AI pipeline where it can respond quickly (or use regional edges).
If your TURN is in one country and your users are worldwide, even successful calls can feel “laggy”.
6.2 Common regional patterns
| Pattern | What it looks like | When it works | Where it fails |
|---|---|---|---|
| Single region | 1 TURN + 1 media cluster | Local users; pilot | Global latency, single failure domain |
| 2 regions | EU + US (or India + SG) | Two large user clusters | Users far from both regions |
| Multi-region | Several TURN/media edges | Global user base | More ops complexity |
Routing approach (simple): pick nearest region in the control plane.
- When user loads the page, your backend chooses a region (GeoIP or latency probe).
- You return region-specific iceServers (TURN URLs) and a region-specific signaling endpoint.
- The call stays in-region as much as possible.
This reduces round-trip time for ICE checks and for media.
7) Bridging to SIP: Asterisk/FreeSWITCH patterns that scale
Many “Talk to Bot” buttons exist because you already have a SIP/PBX world: extensions, IVRs, queues, recordings, compliance, or PSTN. WebRTC becomes a new endpoint type, and you need a bridge.
7.1 The scalable pattern: WebRTC → Gateway → SIP
- Browser uses WebRTC (SRTP + ICE)
- Gateway (Janus) terminates SRTP and speaks SIP/RTP to PBX
- PBX handles dialplan, queues, recording, etc.
Janus is popular here because the SIP plugin fits the bridge model well.
7.2 Where scaling pain appears
- Transcoding: if codecs don’t match, CPU cost rises.
- RTP port management: PBX needs correctly opened RTP ranges.
- NAT: PBX NAT config differs from WebRTC ICE config.
- Recording: recording every call increases I/O and storage.
| Choice | Good default | Why | Scaling impact |
|---|---|---|---|
| WebRTC codec | Opus | Great quality at low bitrate | May require transcoding to/from SIP codec |
| SIP codec | PCMU/PCMA (G.711) | Very common in PBX/PSTN land | Higher bitrate; transcoding if mismatch |
| Scaling strategy | Avoid transcoding when possible | CPU saver | May constrain codec selection |
Scaling tip: decide where transcoding happens (and pay the cost once).
- If Janus transcodes, size Janus for CPU.
- If PBX transcodes, size PBX for CPU.
- If AI pipeline requires PCM16 internally, plan conversion at the edge of that pipeline.
Related: Connect Janus to Asterisk (Extension 7000) Using SIP + ARI
8) AI pipeline scaling: STT/TTS, barge-in, jitter buffers
Once you can carry audio reliably, the next bottleneck is the AI pipeline. Users don’t judge your system by “it connected” — they judge by how fast and natural the bot responds.
8.1 Latency budget (practical)
A human conversation feels good when responses start quickly. A practical target is < 500–800 ms from end-of-user-sentence to start-of-bot-speech, though it depends on use case and language.
| Stage | What happens | Latency risk |
|---|---|---|
| Capture + jitter buffer | Browser/gateway smooths packet variation | Too large buffer = slow feel |
| STT | Speech → text (streaming) | Model speed + network |
| LLM | Reasoning + response planning | Token generation speed |
| TTS | Text → speech | Voice quality vs speed tradeoff |
| Playback | Send audio back to user | Packet pacing; drift |
8.2 Concurrency strategy
- Streaming STT reduces perceived latency (partial transcripts).
- Chunked TTS lets bot start speaking before full sentence is generated.
- Barge-in requires you to stop TTS when user starts speaking.
- Backpressure is essential: when AI is saturated, degrade gracefully.
At scale, your AI vendors/services have rate limits. You must build queueing and fallback logic.
Common scaling failure: media scales, AI doesn’t.
Your TURN and gateway might handle 1,000 concurrent calls, but your STT/TTS capacity might only handle 100. The user experience becomes: “Call connects, bot is slow or silent.”
Treat AI capacity like a core production resource with autoscaling and load shedding.
9) Observability: what to monitor (and why)
Scaling is not only adding servers — it’s knowing what is breaking before users complain. WebRTC gives you excellent client-side stats. Use them.
9.1 Must-have client QoE metrics
| Metric | What it tells you | Why it matters at scale |
|---|---|---|
| Selected candidate type | host / srflx / relay | % relay drives cost and indicates NAT pain |
| Packet loss | Network quality | Predicts user complaints |
| Jitter | Variation in packet arrival | Predicts choppy audio |
| RTT | Round-trip time | Predicts conversational delay |
| Audio levels | Is mic working? is playback working? | Detects permission/device issues |
Collect per-call summaries (not every sample) to avoid huge data volume.
9.2 Must-have server metrics (TURN + gateway)
- TURN allocations per minute, active allocations
- TURN bandwidth in/out, per-region
- Gateway sessions, CPU, memory, packet drops
- ICE success rate, time to connect
- Call setup failure reasons (auth, SDP, ICE, DTLS, media)
At scale, you want dashboards that answer: “Is it our network, our gateway, our AI, or the user’s device?”
Practical logging tip: attach a single call_id everywhere.
- Browser logs include call_id.
- Signaling logs include call_id.
- TURN/gateway session includes call_id (or mapping token).
- AI pipeline logs include call_id.
When something fails, you can trace it end-to-end in minutes instead of guessing.
10) Load testing WebRTC properly (not just HTTP)
A common trap: “We load-tested our API with 10,000 requests per second, so we’re ready.” That tests the signaling server. It does not test the media plane.
10.1 What you must test
- ICE success rate under load
- TURN allocations under load
- Gateway CPU/memory under concurrent sessions
- Audio QoE metrics (loss/jitter) under load
- AI pipeline concurrency and tail latency (p95/p99)
10.2 How to test realistically
- Use headless browsers or WebRTC test clients
- Run tests from multiple networks/regions
- Include TURN/TLS 443 scenarios (enterprise)
- Include packet loss/jitter simulation (tc/netem)
Your goal is not only “connects”. Your goal is “sounds good” under load.
Most important load test output: the “long tail”.
Voice failures often appear at p95/p99 (rare but impactful). Track time_to_first_audio, ice_time, and AI response latency at p95/p99.
11) Security & abuse prevention at scale
When you open a public voice button, you invite abuse: bots, credential reuse, TURN bandwidth theft, and denial-of-service attempts. Security is part of scaling.
11.1 TURN abuse prevention
- Use ephemeral TURN credentials (short TTL)
- Rate-limit session creation per IP/user/token
- Restrict TURN realms/origins and log allocations
- Alert on unusual bandwidth spikes
11.2 Call/session abuse prevention
- Require a signed session token before creating a call
- CAPTCHA or proof-of-work on suspicious traffic
- Hard caps: max call duration, max concurrent calls per account
- Blocklists for repeated offenders
Scaling reality: without guardrails, your TURN bill can become your biggest surprise.
12) Production checklists and common failure modes
12.1 Production checklist (media plane)
| Check | Good looks like | Common failure |
|---|---|---|
| TURN reachable | UDP + TLS 443 both work | Only UDP works; enterprise users fail |
| Relay port range open | Packets on relay range visible | 3478 open but relay ports blocked |
| % relay measured | Dashboard shows relay usage | Costs spike “mysteriously” |
| Gateway CPU headroom | < 60% at peak | High CPU causes jitter/packet drop |
| Multi-region routing | User gets nearest region | All users forced through one region |
12.2 Common failure modes (symptoms → fixes)
| Symptom | Likely cause | Fix |
|---|---|---|
| “Connecting…” forever | No working ICE pair; TURN missing or blocked | Add TURN/TLS 443; verify relay candidates exist |
| Connects, no audio | Relay range blocked; gateway packet drop; codec mismatch | Open relay range; inspect webrtc-internals; check transcoding |
| Audio choppy at peak | Gateway CPU or NIC saturated | Scale out gateway; reduce transcoding; optimize ptime |
| Bot replies late | AI pipeline saturation | Autoscale STT/TTS; add queueing + degradation |
| Works in dev only | NAT/firewall differences in real networks | Test on mobile + corp networks; TURN/TLS |
Quick debugging order (fastest wins first):
- Check chrome://webrtc-internals selected candidate type (host/srflx/relay)
- Force relay for one test call (prove NAT problem vs non-NAT problem)
- Check TURN server logs and relay-port traffic (tcpdump)
- Check gateway CPU and packet loss/jitter metrics
- Check AI pipeline latency and rate limits
Related reading: ICE vs STUN vs TURN — Complete WebRTC Networking Guide
13) References & next reading
Internal (MYLINEHUB) articles
- WebRTC Website Voice Button AI Bot Architecture
- ICE vs STUN vs TURN — Complete WebRTC Networking Guide
- Why WebRTC Calls Fail Behind NAT (and How TURN Fixes It)
- Janus WebRTC Gateway Installation on Ubuntu (Production)
- Best Choice for Click-to-Call AI Bot (Janus vs LiveKit vs mediasoup)
- Connect Janus to Asterisk (Extension 7000) Using SIP + ARI
External reference (standards)
- TURN standard: rfc-editor.org/rfc/rfc5766
Standards references help you validate behavior across vendors and implementations.
Want to see API-driven CRM + Telecom workflows in action? Try the WhatsApp bot or explore the demos.
Comments (0)
Be the first to comment.